

In today’s competitive e-commerce landscape, data-driven decisions are no longer a luxury, but a necessity. Mastering Google Analytics is paramount to understanding your online store’s performance, customer behavior, and ultimately, driving sales growth. This comprehensive guide provides a practical roadmap to leveraging the power of Google Analytics for e-commerce, empowering you to make informed decisions and optimize your online business for maximum success. From understanding key metrics like conversion rate and average order value to advanced techniques like segmentation and custom reporting, this guide will equip you with the knowledge and skills you need to transform your e-commerce data into actionable insights.
This guide is designed for e-commerce professionals of all levels, from beginners looking to understand the fundamentals of Google Analytics to experienced analysts seeking to refine their skills. We will explore the essential reports, metrics, and configurations within the platform, focusing specifically on their application within an e-commerce context. Discover how to track e-commerce transactions, analyze customer behavior, identify top-performing products, and uncover areas for improvement in your online store. By the end of this guide, you will be well-equipped to utilize Google Analytics as a powerful tool to drive data-driven decisions and achieve your e-commerce goals.
Setting Up Google Analytics for Your E-Commerce Store
Setting up Google Analytics correctly is the crucial first step in leveraging its power for your e-commerce business. Accurate data collection is paramount for making informed decisions.
Begin by creating a Google Analytics account and obtaining your unique tracking ID. This ID, starting with “UA-“, needs to be embedded into every page of your online store. Most e-commerce platforms offer streamlined integration with Google Analytics, simplifying this process. Ensure you select the “E-commerce” setting during setup for specialized reporting.
Enhanced Ecommerce provides even deeper insights into customer behavior. Enabling this feature allows you to track interactions at every stage of the purchase funnel, from product impressions and clicks to add-to-cart actions and transactions. This granular data is invaluable for optimizing conversions and maximizing revenue.
Finally, validate your setup to confirm data is being collected properly. The Realtime reporting in Google Analytics allows you to immediately see if tracking is active. Address any discrepancies promptly to maintain data integrity from the outset.
Tracking Key E-Commerce Metrics in Google Analytics
Once you’ve set up e-commerce tracking, Google Analytics unlocks a treasure trove of data. Monitoring key metrics is crucial for understanding your online store’s performance and identifying areas for improvement. Focus on these essential e-commerce metrics:
Revenue Metrics
Track your Product Revenue to understand the total value of products sold. Transactions reveal the number of completed purchases, while Average Order Value (AOV) calculates the average amount spent per order. Understanding these metrics helps assess overall sales performance.
Conversion Metrics
E-commerce Conversion Rate is the percentage of sessions that result in a transaction. This metric highlights the effectiveness of your sales funnel. Cart Abandonment Rate indicates the percentage of initiated purchases that aren’t completed, providing insight into potential friction points in the checkout process.
Product Performance Metrics
Product Detail Views and Buy-to-Detail Rate reveal which products generate interest and successfully convert into sales. Analyzing these metrics can inform product development, marketing strategies, and inventory management.
Understanding E-Commerce Conversion Rates
Conversion rate is a crucial metric in e-commerce, representing the percentage of website visitors who complete a desired action, typically a purchase. A higher conversion rate signifies a more effective sales funnel and improved ROI.
In Google Analytics, you can track your e-commerce conversion rate by navigating to the ‘Conversions’ section, then ‘E-commerce,’ and finally ‘Overview.’ This report provides a top-level view of your overall conversion rate, along with key metrics like revenue, transactions, and average order value.
Understanding your conversion rate is essential for identifying areas for improvement. A low conversion rate might indicate issues with website usability, product pricing, or checkout processes. Analyzing this metric allows you to pinpoint bottlenecks and optimize your online store for better performance.
By segmenting your audience, you can gain deeper insights into conversion rate variations. For example, analyzing conversion rates by traffic source, device type, or demographics can reveal which segments are converting well and which require further attention.
Analyzing Customer Behavior on Your Website
Understanding customer behavior is crucial for optimizing your e-commerce store. Google Analytics provides powerful tools to analyze how users interact with your website, allowing you to identify areas for improvement and enhance the customer experience.
Behavior Flow visually represents the paths users take through your site. This helps pinpoint where users drop off or encounter navigation issues.
Site Search data reveals what customers are looking for on your website. Analyzing search terms can uncover unmet needs or opportunities to improve site navigation.
Landing Page reports show which pages users enter your site through. This data informs which landing pages are most effective and helps tailor content to specific campaigns.
Exit Pages identify where users leave your site. High exit rates on specific pages may signal problems with content, page layout, or calls to action.
Using Google Analytics to Improve Product Performance
Google Analytics provides invaluable insights into individual product performance, enabling data-driven decisions to optimize your e-commerce offerings. By analyzing specific product metrics, you can identify top performers, underperforming products, and opportunities for improvement.
Product Performance Reports within Google Analytics offer granular data on product revenue, quantity sold, average price, and even the average order value when a specific product is included in a transaction. This data can be segmented further to understand performance across different user demographics, acquisition channels, or geographic locations.
Identifying low-performing products allows for strategic adjustments. You can investigate why a product isn’t selling well. Is it pricing, product description, or visibility on the site? This information can inform decisions about price adjustments, improved marketing copy, or better product placement within your online store.
Conversely, understanding high-performing products helps identify trends and replicate success. What aspects of these products resonate with customers? Analyzing these patterns can inform future product development and marketing strategies.
Optimizing Your Checkout Process with Google Analytics
A streamlined checkout process is crucial for maximizing e-commerce conversions. Google Analytics provides valuable insights into user behavior during checkout, allowing you to identify and address friction points.
Funnel Visualization is key. Set up a Goal in Google Analytics representing a completed purchase. The Funnel Visualization report then reveals the steps users take and where they abandon the process. This allows you to pinpoint problematic steps with high drop-off rates.
Analyze the Checkout Behavior Analysis report to understand user interactions within each step of the checkout funnel. This report helps identify areas where users hesitate or encounter difficulties. For example, a high exit rate on the shipping information page might indicate confusing form fields or a lack of shipping options.
By examining these reports, you can identify areas for improvement. Perhaps you need to simplify form fields, offer more payment options, or clarify shipping costs upfront. A/B testing variations of your checkout process, tracked through Google Analytics, empowers data-driven optimization for increased conversions.
Leveraging Google Analytics for Marketing Campaigns
Google Analytics offers invaluable insights for optimizing your marketing campaigns. By tracking key metrics, you can understand which campaigns are driving the most valuable traffic and conversions.
Utilize campaign tracking parameters in your URLs to differentiate traffic sources. This allows you to segment data and analyze the performance of specific campaigns within Google Analytics. Track metrics such as bounce rate, session duration, and conversion rate to assess campaign effectiveness.
By analyzing this data, you can identify high-performing campaigns and allocate more resources to them. Conversely, understanding underperforming campaigns allows for adjustments to targeting, messaging, or creative elements.
Experiment with different campaign strategies and analyze their results in Google Analytics. This data-driven approach empowers you to refine your marketing efforts and maximize your return on investment. Pinpoint the channels and campaigns that resonate most with your target audience and optimize accordingly.
Segmenting Your Audience for Targeted Marketing
Segmentation is crucial for effective marketing. By dividing your audience into distinct groups based on shared characteristics, you can tailor your messaging and offers for maximum impact. Google Analytics provides powerful tools to create these segments, letting you analyze user behavior and preferences.
You can segment your audience based on various demographics (age, gender, location), behavior (purchase history, site engagement), technology used (device, browser), and more. For example, you might create a segment of users who have added items to their cart but haven’t completed a purchase. This allows you to target them with specific reminders or incentives.
Creating targeted segments provides a granular view of customer behavior, enabling you to identify your most valuable customers, understand their needs, and optimize your marketing efforts accordingly. This leads to higher conversion rates and a stronger return on investment.
Generating Custom Reports in Google Analytics
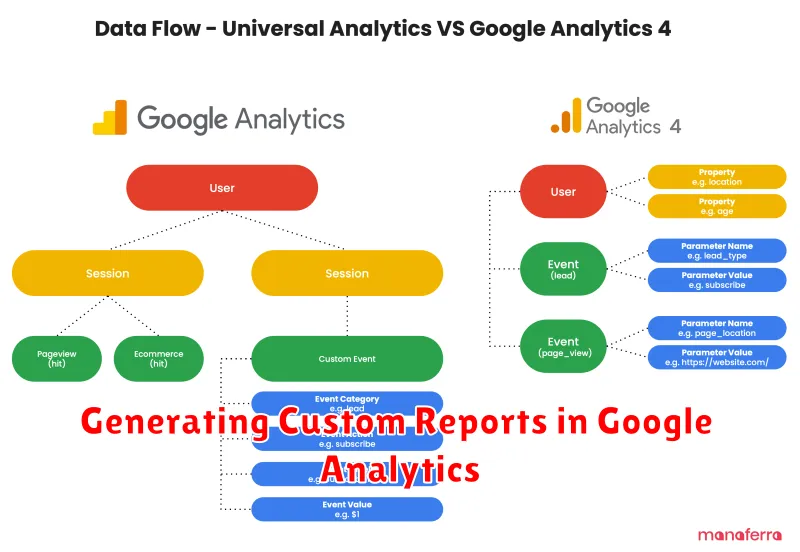
Custom reports in Google Analytics offer the flexibility to analyze specific data points relevant to your e-commerce business. They go beyond the standard reports, allowing you to tailor the information displayed.
Begin by navigating to the “Customization” tab and selecting “Custom Reports.” Click “+ New Custom Report.” Here, you’ll define the report’s metrics (e.g., transactions, revenue, average order value) and dimensions (e.g., product, source/medium, location). This combination determines the insights the report will provide.
Consider creating custom reports to monitor specific aspects of your e-commerce performance, such as:
- Product Performance: Track sales, conversion rates, and revenue by product.
- Marketing Channel Effectiveness: Analyze performance across different marketing channels.
- Customer Behavior: Understand customer purchase patterns and engagement.
By selecting the right metrics and dimensions, you can construct highly targeted reports that reveal actionable insights, helping you optimize your e-commerce strategy.